
Spectrum Analyzer:
A Spectrum Analyzer is a frequency selective voltage indicator. That is it indicates the magnitude of the input signal in the frequency domain. The voltage indicator incorporated in a spectrum analyzer is a Cathode Ray Tube. Therefore we can say that a spectrum analyzer is a special purpose cathode ray oscilloscope that presents a calibrated graphical pattern in the frequency domain. That is unlike the conventional CRO the horizontal deflection is based on the frequency of the input signal. The amplitude of the input produces the vertical deflection. On a spectrum analyzer the sinusoidal components of a high frequency input signal are represented as vertical lines. The spectrum analyzer offers a graphical representation of frequency spectrum over a specified band of frequency. There are two techniques used with spectrum analyzer.
(a) Parallel filter bank technique.
(b) Swept frequency technique.
(a) Parallel Filter Bank Analyzer:
The principle of a parallel filter bank analyzer is illustrated in Figure. The range of the input signal will be covered using number or filters. The center frequency and the bandwidth of the filters will be designed such that the frequency band of each filter overlaps on the frequency band of the other filters.
The output of all such filters will be applied to the cathode ray tube simultaneously. The display will be the frequency versus signal amplitude plot. Parallel Filter bank analyzers are used mostly to analyze signals in the audio frequency range and up to around 100 kHz. In order to cover the audio frequency range 32 filters will be employed, such that each filter will cover one third of an octave.
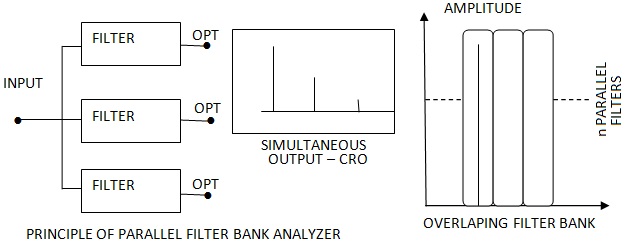 |
| Parallel Filter Bank Analyzer Principle |
(b) Block Diagram of Parallel Filter Bank Analyzer
The block diagram of Parallel Filter Bank type of spectrum analyzer is shown in Figure.
From the block diagram it can be seen that there are 32 narrow band filters. The input signal is connected in parallel to all the filters. The output of all the filters reaches the high speed scanner.
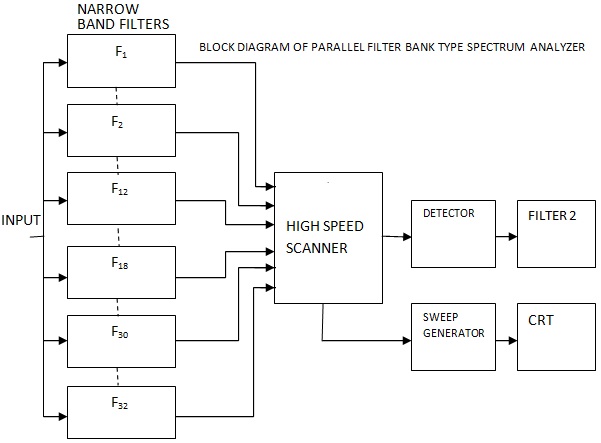 |
| Block Diagram of Parallel Filter Bank Type Spectrum Analyzer |
The output from the scanner is supplied to a detector. The detector's output reaches a filter, from where it reaches the CRT, as the vertical drive voltage. The- sweep generator produces the horizontal drive. Further the sweep generators output is given to the high speed scanner. The scanning of the high speed scanner is controlled by the sweep generator.
(c) Working:
From the block diagram we observe that the input is connected in parallel to the different narrow band filters. The number of filters covers the audio frequency range providing an overlap on each filters band width. The high speed scanner controlled by the sweep generator, presents the component of the signal to the detector, at the rate determined by the sweep generator. These signal components are filtered and given to the horizontal driver of the CRT to represent the magnitude. The sweep generator correlates the horizontal position. Therefore the pattern observed on the CRT will represent the amplitude versus frequency band plot.
(d) Swept Frequency Spectrum Analyzer:
The block diagram of a spectrum analyzer of swept frequency type is shown in Figure. It can be seen from the block diagram that the horizontal deflection is obtained from a saw tooth wave generator. The output of the saw tooth wave controls the frequency of the Voltage Controlled Oscillator (also called the voltage tuned oscillator). Therefore the frequency of the VCO sweeps between a frequency minimum and a frequency maximum in its frequency range (band) linearly. This sweep is repeated at a rate controlled by the saw tooth voltage.
The output of the VCO is given as the second input to the mixer stage. The input signal under examination is given as the first input to the mixer. As the VCO's frequency is being swept from fmin to fmax repeatedly a beat signal will be produced by the mixer. This beat signal is the difference frequency signal between the frequency component of the input signal and the VCO's frequency. This difference frequency can be termed as the intermediate frequency the IF.
An IF amplifier is employed to amplify the IF signal. The output of the IF amplifier reaches a detector. The detected output is amplified. The amplified voltage is given as the vertical drive voltage to the CRT. The CRT produces a pattern that represents the amplitude versus frequency plot.
 |
| Block Diagram of Swept Frequency Type Spectrum Analyzer |
(e) Applications of Spectrum Analyzers:
The following are the applications of Spectrum Analyzers of
1. Measurement of signal purity
2. Modulation characteristics
3. Testing component linearity.
4. Pulse shape analysis.
5. Noise measurement.
6. Study of RF spectrum in microwave instruments.