Transcutaneous flow detectors are designed to use the Doppler effect to detect the flow of blood in arteries close to the surface of the body. Here we use two piezoelectric crystals. One for the transmit function and the other for reception. These two piezoelectric crystals are placed in a plastic housing and positioned over a peripheral artery. The schematic ultrasonic flow meter diagram is shown in figure.
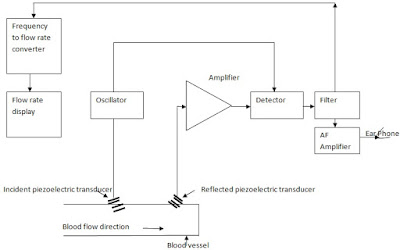 |
| ultrasonic flow meter diagram |
An oscillator of desired frequency (say 10 Mhz) is used to produce an alternating signal which is to be applied to the input transducer. The oscillations cause the piezoelectric crystal to generate pulses. Suppose the blood is moving at the transmitter piezoelectric crystal (input) with a certain flow rate. The pulses cause the velocity (flow rate) of blood to change when it reaches the receiver piezoelectric crystal which is placed near the transmitter, due to change in velocity between transmitter and receiver piezoelectric crystals. Doppler effect will come into play. So there will be a drift in frequency at the receiver side. The moving blood produces a shift that is proportional to the blood flow rate. A frequency shift of approximately 200 Hz at 10 Mhz corresponds to a blood velocity of approximately 6 cm/s. By exactly calculating the frequency shift, we can indirectly convert it to the flow rate of blood. The signal at the output of the receiver crystal is amplified and then fed to the detector.

