
A CRO can be used in number of ways to measure frequency when two sources of identical frequencies are available. The frequencies may also have harmonic relationship with each other. The CRO establishes the harmonic relationship without the necessity of generating the harmonic. The three methods commonly used for measurement of frequency using CRO are listed below.
It can be observed from the figures that when the phase difference is `W, the patterns observed are interesting. When the frequency ratio is 1 we get a circle, for a ratio of 1:2 we get a figure of eight and so on. The patterns observed for ratios 2:3 and 3:4 are slightly complicated. To determine the frequency ratio of such complicated patterns the following procedure is used. If a tangent is drawn against the top edge of the pattern for 2:3 pattern it will make contact with the pattern at two places. Similarly drawing a vertical tangent along the vertical side will contact at three places. So it is evident that the horizontal tangencies correspond the vertical frequency in their number and the vertical tangencies correspond the horizontal frequency, hence the ratio 2:3. The same rule can be applied to pattern of 3:4 frequency ratio, or in general any pattern of this type. It is to be noted here that the pattern not only depends on the frequency of the voltage applied to the deflecting plates but also on their phase. So the circle can be obtained only if the ratio is 1 and phase difference is 90°. If the ratio is I and the phase is not specified a straight line inclined to right or left, an ellipse inclined to right or left, or a circle can appear.
1. Lissajous figures.
2. Spot wheel pattern.
3. Gear wheel pattern.
(a) Lissajous Figures Method :
This is the simplest method to determine the frequency relation of two sine wave voltages. One voltage is used to produce vertical deflection, while the second is used to give the horizontal deflection. lf the ratio of the two frequencies involved can be expressed by an integer, or by a ratio of integers the pattern obtained on the CRO is dependent on the relative phase of the two signals. (Phase measurement can also be made in this way).
The pattern will be stationary when the ratio of the two frequencies is correctly a ratio of integers. The ratio of horizontal to vertical frequency is given by the number of times the figure (pattern) is tangent to the horizontal line divided by the number of times its end is tangential to the vertical line. This rule is valied when the forward and return traces do not coinside. When the phase difference is 0° and 180° they do coinside, and the rule is not applicable in those conditions.
When the frequency ratio of the two signals is not exactly equal then the pattern will rotate or barrel or wave about as i f the relative phase of the two deflecting signals is continuously changing. If the frequencies differ very much we see only a luminous rectangle on the screen.
Lissajous figures for different frequency ratios and phase angle are shown below in Figure.
 |
| Lissajous figures method |
It can be observed from the figures that when the phase difference is `W, the patterns observed are interesting. When the frequency ratio is 1 we get a circle, for a ratio of 1:2 we get a figure of eight and so on. The patterns observed for ratios 2:3 and 3:4 are slightly complicated. To determine the frequency ratio of such complicated patterns the following procedure is used. If a tangent is drawn against the top edge of the pattern for 2:3 pattern it will make contact with the pattern at two places. Similarly drawing a vertical tangent along the vertical side will contact at three places. So it is evident that the horizontal tangencies correspond the vertical frequency in their number and the vertical tangencies correspond the horizontal frequency, hence the ratio 2:3. The same rule can be applied to pattern of 3:4 frequency ratio, or in general any pattern of this type. It is to be noted here that the pattern not only depends on the frequency of the voltage applied to the deflecting plates but also on their phase. So the circle can be obtained only if the ratio is 1 and phase difference is 90°. If the ratio is I and the phase is not specified a straight line inclined to right or left, an ellipse inclined to right or left, or a circle can appear.
Lissajous figures become difficult to interpret if the frequency ratio is large as complicated patterns will result. Alternate methods are available as described here under.
(b) Spot Wheel Method :
In this method a circular sweep is produced using the low frequency source and a R.C. combination in series. When the mid-point of the series combination is taken as reference the voltages out of the other two terminals will have a phase difference of 90°. This is called the phase splitting network. The resistance is so chosen that its value is equal to the capacitive reactance at the working frequency. Then the magnitudes of the voltages produced across the two will be equal. This R.C. series phase splitting network satisfactorily works only at one frequency.
The arrangement for split circle or spot wheel method of measurement is shown below along with typical pattern in Figure.
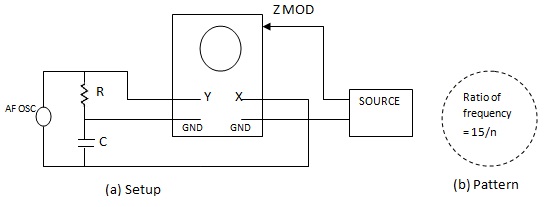 |
| Spot Wheel Method of Measurement of Frequency |
The low frequency is used with the phase splitter to get the circular sweep. The high frequency signal is used to modulate the intensity of the electron beam. This can easily be done by applying the high frequency voltage to the Z-modulation terminal of the oscilloscope. This terminal is made available usually on the rear side of the instrument and is accessible through an opening. The resultant pattern consists of a circle of spots in which the ratio of the high frequency to the low frequency is equal to the number of spots divided by a suitable integer 'n' that is less than the number of spots. The pattern will be the same for different values of 'n' so that the proper value of this integer must be determined from other information such as prior knowledge for approximate frequency.
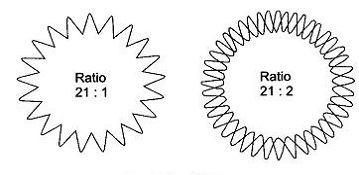
(c) Gear Wheel Method :
An R.C. series phase splitting unit is used in this method to produce a circular sweep supplied by the low frequency signal. The high frequency signal is given to the radial deflecting electrode. This causes the beam to move regularly in and out in accordance with the amplitude and frequency of the high frequency wave. The number of teeth in the wheel pattern that results, divided by the number of times a radial line from center outwards that intersect the pattern, gives the frequency ratio. The Gear wheel pattern is shown below Figure.
 |
| Gear Wheel Method |
Tags:
Cathode Ray Oscilloscope