
THE STANDARD ECG LEAD SYSTEM:


There are two types of leads used for the ECG measurement System. They are called unipolar and bipolar leads. The unipolar electrode have only one true pole(positive pole).The bipolar leads have one positive and one negative pole. In the standard ECG recording, there are five electrodes connected to the patient. They are
I) Right Arm (RA).
2) Left Arm (LA).
3) Left Leg (LL).
4) Right Leg (RL).
5) Chest( C).
The standard lead I is the signal between the Right Arm ( RA) electrode (negative) and the Left Arm(LA) electrode(positive).Standard lead II is the signal between the negative Right Arm (RA) electrode and the positive Left Leg(LL) electrode. Lead III is the signal between the negative LA electrode (Left Arm) and the positive Left Leg (LL) electrode.(Refer figure) Three augmented limb leads are also shown in the figure .These are 'aVR', ‘a VL' and 'a VF'.
• The lead 'a VR' or augmented vector right has a positive electrode on the right arm. The negative electrode is the combination of left arm electrode and left leg electrode which augments (increases the strength) the signal strength of positive electrode on the right arm.Hence this electrode is called augmented vector right.
• Lead 'a VL' or augmented vector left has a positive electrode on the left arm. Here the negative electrode is the combination of right arm electrode and the left leg electrode which augments the signal strength of positive electrode on the left arm.
• Lead 'a VF' or augmented vector foot has the positive electrode on the left leg. The negative electrode is a combination of the right arm electrode and the left arm electrode which augments the signal of the positive electrode on the left leg.
The different electrodes are connected to the inputs of differential amplifier through a lead selector switch. The recordings obtained by placing different pair of electrodes results in different waveform shapes and amplitudes. These different waveforms are called views. An important point about the lead placement to he noted is that each lead conveys a certain amount of information that is not available in the other leads. The physicians are expertise in diagnosing the type and site of heart disease by examining the ECG waveforms or views. Interpretation of ECG relies on the fact that different leads can give different views from different angles. This has the benefit that the leads which are showing problems can be used to guess which region attic heart is affected. Each of 12 views created by the ECG is shown in a short segment in the printed ECG report generated by the ECG machine. Often a longer reading of one oldie 12 views is printed out in a rhythm strip.
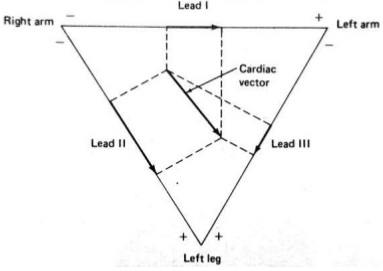
EINTHOVEN TRIANGLE
As told earlier, we normally use three standard leads for ECG measurement System. During his work with ECG from these three standard leads Einthoven put forward a new postulation. He studied the relationship between these electrodes, forming a triangle where the heart electrically constitutes the null point. The relationship between the standard leads Einthoven triangle. The points of this triangle represent the electrode positions for the three limb leads. He proved that at any instant of the cardiac cycle, the frontal plane representation of the electrical axis of the heart is a two dimensional vector. Einthoven assumed that the heart is near the center of an equilateral triangle.( refer figure)
Einthoven's law states that the potential differences between the bipolar leads measured simultaneously will , at any given moment, have the values II = I + III. The above said Einthoven's rule is a relationship between the amplitude of the QRS complexes in each lead.
ECG WAVEFORM

Schematic representation of a normal ECG waveform is shown in figure. A typical ECG representation of the normal cardiac cycle consists of a P- wave, a QRS complex and a T- wave. A small U-wave is also visible in most ECGs. Each segment of the ECG waveform is discussed below. The below given explanation is related to the standard ECG waveform. The shape, polarity etc may vary with the location of measuring electrode and the cardiac condition of patient.
Baseline: The horizontal segment of the waveform before the P- wave is called baseline or iso-potential line. The baseline voltage of the electrocardiogram is also knows as the isc electric line. Typically the basic line is measured as the portion of the tracing following the T-wave and preceding the next P- wave.
P- wave: Simply the P- wave represents the depolarization of the atrial muscles. During normal atrial depolarization, the main electrical vector is directed from the SA node towards the (AV node and spreads from the right atrium to the left atrium. This results in P- wave.
QRS Complex: The QRS complex is a recording of a single heart beat on the ECG that corresponds to the depolarization of both ventricles. So it is a combined result of re-polarization of atria and depolarization of ventricles.
PR interval: PR interval is measured from the beginning of the P wave to the beginning of QRS complex.
T - wave: The T-wave represents the recovery or repolarization of ventricles. The interval from the beginning of QRS complex to the apex of T- wave often referred to as absolute refractory period. The second half of the T- wave is called relative refractory period.
U - wave: Actually U- wave is the result of after potentials of the ventricular muscles. The U- wave is not seen in all ECG waveforms. It is typically small.