
There are several methods of measurement of distortion. The important methods are
1. The use of tuned circuit to tune to the frequency component. This is called tunable selective type of measurement.
2. Heterodyne distortion meter or Heterodyne wave analyser.
3. Fundamental suppression method of distortion measurement.
(a) Distortion Measurement Using Tunable Selective Amplifier :
The arrangement for measurement of distortion using tunable selective amplifier is shown in Figure. Input signal reaches the attenuator. The first stage is an emitter follower stage that couples the attenuator to the input of the tunable amplifier. The tunable amplifier is of the R.C. timed type. The output of the amplifier is connected to the electronic voltmeter for indication.
 |
| Tunable Selective Type of Distortion Factor Meter |
The measurement procedure involves in applying the signal to the input terminals, tuning the R.C. tuned amplifier to the harmonic frequencies and noting the reading in the electronic voltmeter. The meter can be calibrated in terms of R.M.S. distortion.
The attenuator works as a range multiplier and allows application of large signal amplitudes to be analyzed without overloading the amplifier. The calibration can be done by an auxiliary signal generator which applies a known voltage to the input. If the amplifier is designed with constant gain for all the frequencies of the tuning, the attenuator can be set to give the harmonic components directly as a fraction of the fundamental amplitude.
The choice of the R.C. tuned amplifier is because of its wide tuning range and as it does not use coils that complicate the measurement. Also the bandwidth of the response characteristic of the R.C. tuned amplifier is substantially constant percentage over the entire tuning range.
(b) Distortion Measurement Using Heterodyne Wave Analyser :
The block diagram of the heterodyne wave analyser is shown in Figure. A balanced mixer is used which receives its input from the tunable oscillator. The other input to this balance mixer is from the attenuator. The wave to be analysed is passed through the attenuator to the balanced mixer. As the balanced mixer has two inputs, and as it is a nonlinear device, it produces a heterodyne signal. The output of the balanced mixer is applied to a highly selective multistage amplifier. This amplifier has a predetermined fixed response frequency that is higher than any of the frequencies contained in the unknown wave. The output of the selective amplifier is indicated by an electronic voltmeter or equivalent.
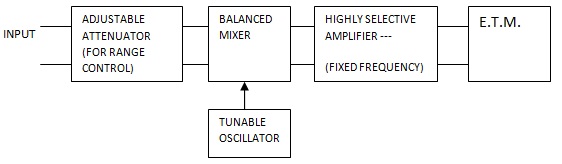 |
| Block Diagram of Hetrodyne Wave Analyser |
To determine the amplitude of the harmonic component, the local oscillator is adjusted to get the heterodyne frequency produced by the mixer to be equal to the resonant frequency of the selective amplifier. As the input is available at the input of the balanced mixer, the component to be determined has its frequency transformed to the predetermined value of the selective amplifier. Though the other frequency components also produce the corresponding difference signal (beat signal) in the output of the balance mixer, they will be rejected by the highly selective amplifier.
The amplitude of the unknown component of the input signal can be measured by the electronic multimeter. It can as well be calibrated in terms of amplitude. The frequency of the unknown component can readily be known from the frequency to which the local oscillator is tuned to get the required beat signal. Heterodyne wave analysers may use crystal filters or ordinary resonant circuit with high "Q".
(c) Fundamental Supression Method of Distortion Measurement :
R.M.S. distortion can be measured by suppressing the fundamental frequency component of a signal and measuring the remaining part of the signal. When the output is measured by a thermocouple, or square wave electronic voltmeter, the R.M.S. value is realised correctly. However rectifier type of instruments works well with a small error.
The fundamental of a signal can be suppressed using a high pass filter, designed to pass the harmonic only. The filter design must attenuate the fundamental. Alternately bridged T networks balanced to the fundamental frequency and unbalanced for the harmonics can be used. Resonance bridge, Bridge T, Wien Bridge can be employed for this purpose.
The block diagram of fundamental suppression type of distortion factor meter is shown in Figure. The arrangement consists of an attenuator bridge T network and a switch. The output of the bridge T network is given to the output indicator.
 |
| Block Diagram for Fundamental Supression Method |
The switch S is set to the first position "A" and the input signal is applied. Now the bridge T network is adjusted for the fundamental frequency. Therefore the indication will be low. The switch is now set to position "B" and the attenuator is adjusted to give the same indication as before. It is to be noted that in this position the bridge T network is shorted. The attenuator reading gives the R.M.S. distortion defined in decibles.
Tags:
Signal Generators